
Engagement Events on SoundCloud: What Artists Should Track

Almost everyone calls themselves a fan. In 2025, 96% of fans surveyed in the United States, United Kingdom and Australia for Vevo's annual Media Tracker identified as part of a fandom, according to Vevo's report on music fandom as cultural currency. That number is exactly why a full room tells you so little. If nearly every listener claims a fandom, an event that packs a venue has proved only that people will show up for something loud, free and nearby.
Attendance, plays on release day and ticket revenue all describe the moment. Repeat plays, comments that continue past week one, and profile visits from listeners who weren't in the room describe the relationship. Read the second set and you'll know which events deserve a second date.
Table of Contents
- What Counts as an Engagement Event on SoundCloud
- Why Registration Totals Mislead Artists
- Timing Engagement Around Releases and Catalog Plays
- Matching Entry Points to Eclectic Listeners
- How to Track Event-Origin Listeners
- Avoiding Misleading Metrics Before Your Next Event
What Counts as an Engagement Event on SoundCloud
An engagement event is any recorded listener action that shows a track or profile is being noticed. A play is one. So is a like, a comment, a repost, a playlist add, a profile visit, and a new follower. The word "event" makes people picture a launch party or a livestream, but the actions that compound on SoundCloud are smaller and far more frequent. They're the taps a listener makes while deciding whether to care about you.
A passive signal costs the listener almost nothing. A play that lasts four seconds because your track autoplayed after something else is a passive signal. It tells you the queue delivered your music to a pair of ears, and nothing more than that.
An active signal costs something real. A comment that names the moment at 1:20 cost someone's attention. A repost costs a slice of their own reputation, because their followers will see what they pushed. That cost is what makes active signals worth more when you compare two releases against each other.
Practical rule: weight one full listen plus a comment above ten silent plays. The first shows a decision. The second shows a delivery.
Relevance is the line SoundCloud draws too. The platform's older published Community Guidelines describe the standard as a balance between promotion and spam: promotion is encouraged, but messages and actions should be personal and relevant, and making your own popularity appear artificially inflated can be treated as spam. That guidance also notes an account may be suspended after more than two warnings. A real engagement event is one where the listener did something specific, not one where the same sentence appeared on forty profiles in an evening.
The seven events and what each one proves
Here's the reference sheet. Every comparison you make about an event should land on one of these seven rows, and each has a measure that turns it into a number you can track across releases.
| Event | What It Signals | How to Measure It |
|---|---|---|
| Play | Passive interest; the track was heard | Plays per release week and plays per unique listener |
| Like | Quick approval of the track | Likes per 1,000 plays |
| Comment | Conversation and personal reaction | Comments per 1,000 plays, with repeat commenters noted |
| Repost | The listener recommends the track to their own audience | Reposts per 1,000 plays in the first 7 days |
| Playlist add | Sustained interest beyond one listen | Number of playlists that include the track over time |
| Profile visit | Curiosity about the artist, not only the track | Profile visits in the 72 hours after a post, against the same window a week earlier |
| New follower | An ongoing relationship with the artist | New followers per event cohort, tracked at 7 and 30 days |
Look at what the third column does. It converts every event into a rate, so a quiet week of 200 plays and 6 comments can be compared with a big week of 4,000 plays and 30 comments. Six comments per 200 plays is the stronger result. If you want the mechanics behind why plays and likes so rarely move together, this explanation of SoundCloud plays and likes covers the gap well.
No single row proves anything alone. A repost with no repeat plays is a spike. A comment with no new follower is a conversation. Read the rows together and a picture forms.
Why Registration Totals Mislead Artists
A bigger platform sounds like a bigger audience, and that assumption breaks the first time you look at the platform's own history. SoundCloud's registered users rose from approximately 55 million in 2012 to 150 million in 2015, a nearly threefold increase in three years. Then the curve reversed. The reported total fell to roughly 85 million in 2018 after the company removed more than 70 million inactive accounts, before recovering to about 140 million in 2023, as Barrett Media's analysis of independent artists and audience growth sets out.
Think of a guest list. A clipboard with 150 names on it is not a room full of people, and the names worth keeping are the ones who show up again next week. Registration counts behave the same way. They accumulate, they include everyone who ever signed up and drifted away, and they say nothing about who's listening tonight.
Here's the comparison worth putting side by side.
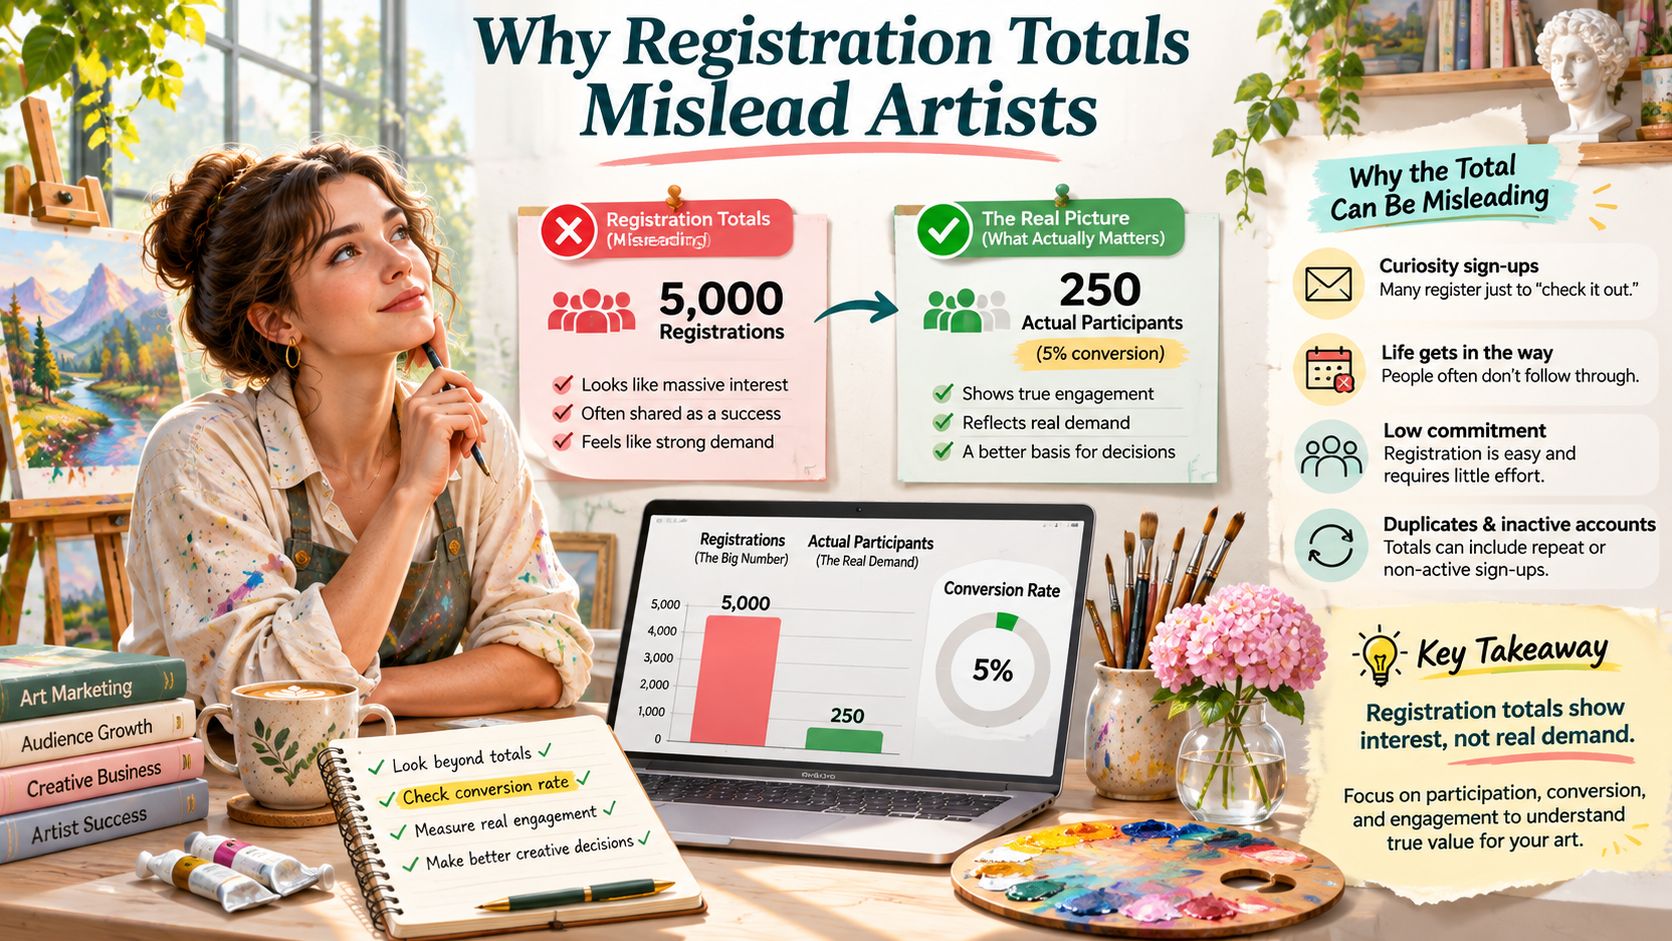
The ratio that survives a platform reset
Forget the platform total and build your own. Two numbers matter for any release: total plays, and the unique listeners who came back for a second play within 30 days. Divide the second by the unique listeners in that window and you have a returning-listener ratio, a percentage you can compare across releases, events and seasons.
A release with 6,000 plays and 300 returning listeners is healthier than one with 20,000 plays and 250.
The lesson is uncomfortable and useful at the same time. The platform's size moves for reasons you can't influence, whether that's a purge of dormant accounts or a policy change. Your returning-listener ratio moves for reasons you can influence: the event you ran, the track you pointed people toward, whether you gave anyone a reason to come back. Track that one and stop refreshing the other.
Timing Engagement Around Releases and Catalog Plays
SoundCloud listeners lean toward new music harder than the average listener does. Current music accounted for more than 46% of plays on SoundCloud in each of the previous three years, and the platform reported that its users gave about 43% of their listening time to new music, against roughly 24% for the industry overall in the United States, according to SoundCloud statistics compiled by Axis Intelligence. That's almost double the wider market's appetite for what's fresh.
Which explains why launch week feels so good, and why it's a trap. An audience primed for what's new will move to the next new thing unless you give it a reason to stay past the weekend.
The catalog data argues against launch-day tunnel vision. Music more than 18 months old grew its share of consumption in 2024, and catalog-album consumption increased 6.5%, more than twice the growth rate of current albums, per the same Axis Intelligence compilation.
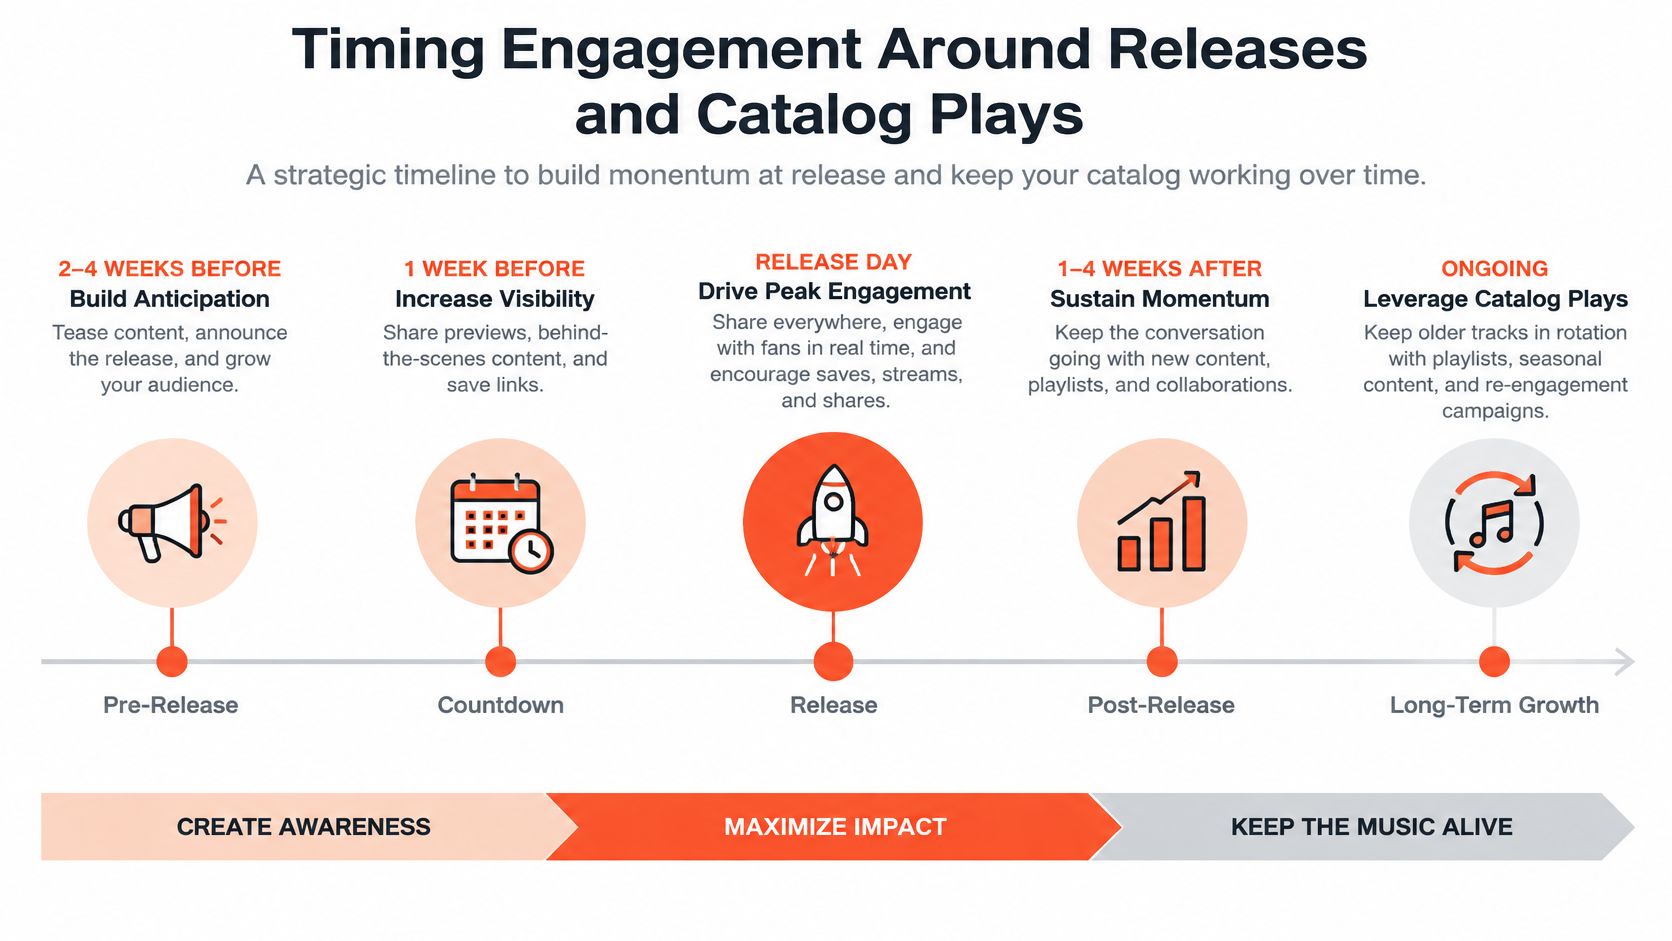
Five windows, five different jobs
A release has more than one moment worth planning around, and each window asks a different action from the listener. This guide to music release strategy maps the full sequence if you're building a campaign from scratch.
| Window | Event to Run | Measure to Check |
|---|---|---|
| Release day | Launch post asking listeners for their reactions | Likes and comments in the first 24 hours |
| First two weeks | Reposts per 1,000 plays and new followers gained by day 14 | |
| Month two | Live session or remix invitation for returning listeners | Returning listeners as a share of unique listeners |
| Six months to one year | Revisit session that reintroduces the release | Repeat plays of the track in the window |
| Catalog moments | Anniversary or revived-mix event built on an older track | Repeat plays of the older track after the themed session |
An engagement event isn't only a release-day tool. It's also the mechanism that brings a two-year-old track back into circulation, which is where the 6.5% catalog growth comes from at ground level. Anniversary posts, a reworked mix, a guest verse added to something you put out in 2023: each one is an event with a measurable outcome, and each one costs far less than a new campaign. Plan the release for the first two windows and the catalog for the last three, and you stop treating your own back pages as dead weight.
Matching Entry Points to Eclectic Listeners
That changes how you design the event itself. The question stops being "how do I promote this" and becomes "which door did this listener walk through". Four doors are worth comparing.
| Entry Point | Best For | Measure With |
|---|---|---|
| New single | Plays and comments in the first 7 days | |
| Catalog track older than 18 months | Listeners who arrive late and explore back catalogs | Repeat plays 30 days after the event |
| Collaborator's audience | Reaching listeners from another scene | Profile visits and reposts from the collaborator's audience |
| Listener recommendation | Eclectic listeners who discover through others | Share of returning listeners who came through the recommendation |
Three formats that suit listeners without a genre
A themed listening session built around one mood rather than one genre works because it gives eclectic listeners a reason to sit through tracks that don't share a label. Pick a tempo, a season, a city at 3am. The theme does the curating.
A deep-cut night puts an older track at the centre and treats the newest single as the support act. It sounds backwards until you remember that the back catalog is where the patient listeners live.
A remix or stem challenge hands listeners something to make. Everyone who submits has spent real time with your song, which is the most convincing engagement signal there is, and each submission travels to their own audience.
Balance personalisation with discovery
The test for any format: would a listener who arrived through a completely different artist still find something here to respond to?
Measure the result by the track pathway that brought each listener in, not by total turnout. If the deep cut produced more repeat plays than the new single, that's an answer worth acting on, and it costs you nothing to learn.
How to Track Event-Origin Listeners
Turnout is the easiest number to collect and the least informative. Coverage of a creator-economy survey reports that 41% of surveyed fans attended at least one creator-led in-person event in the previous year, and 34% said they'd be comfortable paying $50 or more for a full live performance, per the Influencer Marketing Factory's creator survey coverage. Read those together and the temptation is obvious: build the event, sell the ticket, count the room.
Neither figure says a word about whether the people in that room became listeners. Attendance measures who had a free Thursday. A cohort measures who changed their behaviour, and building one takes a handful of deliberate steps.
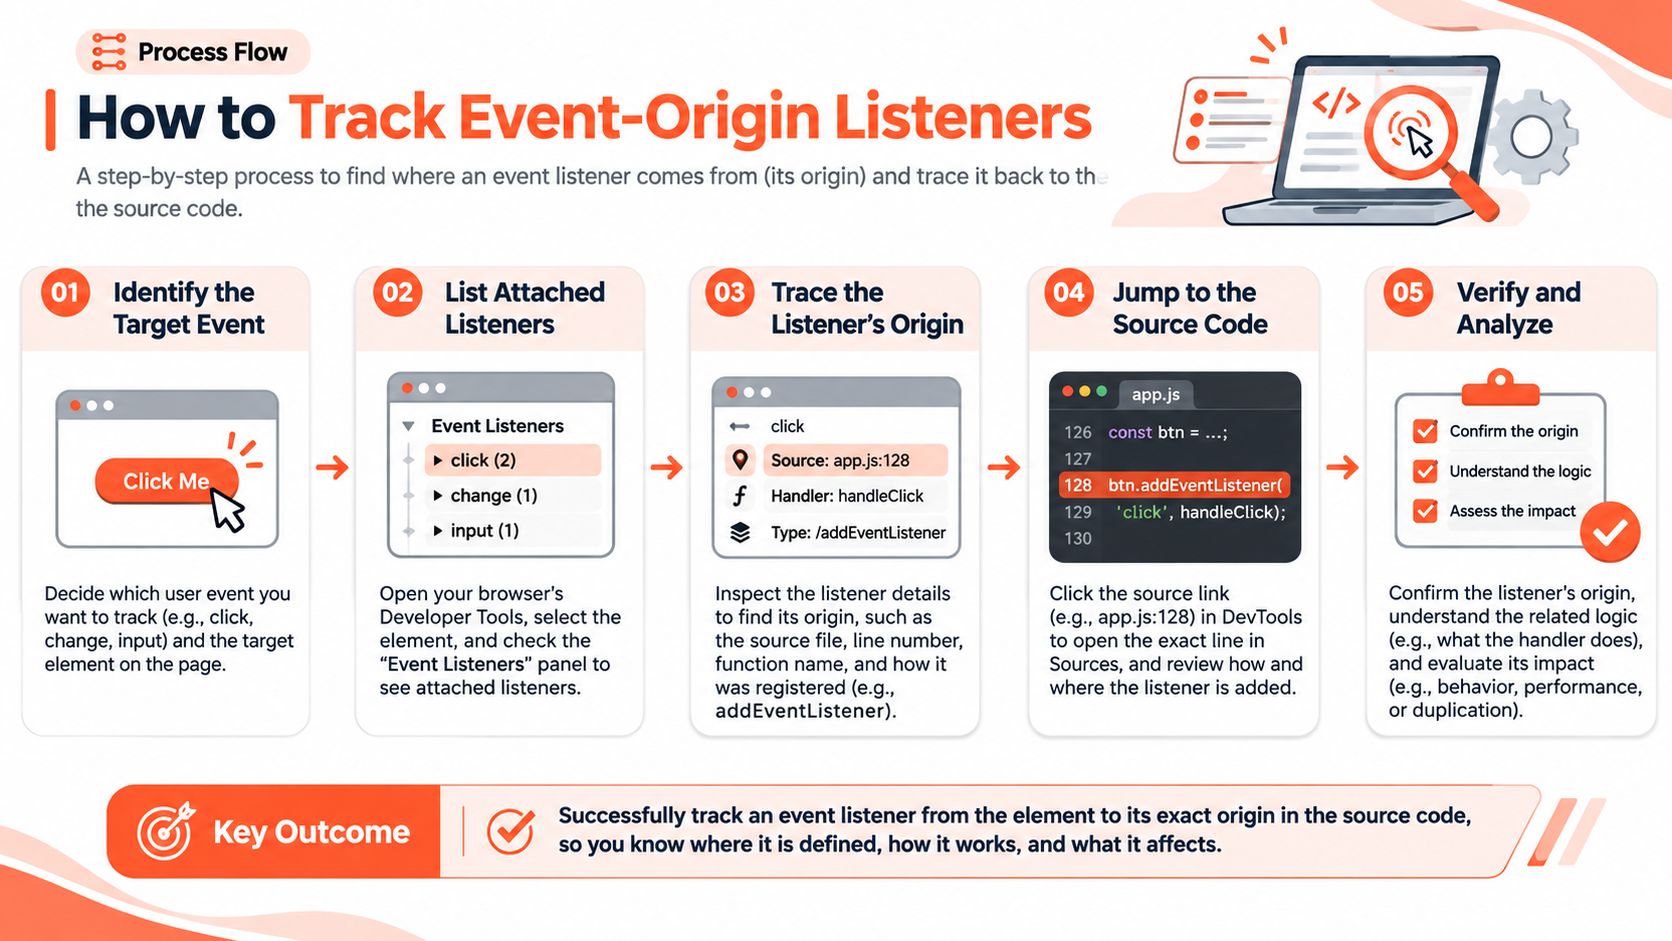
Eight steps from a room to a measurable cohort
- Tag the event. Use a dedicated sign-up link, a posted event code, or a dated playlist so an event-origin listener can be identified months later. The common slip is relying on memory or a paper list nobody digitises. The same logic as sharing SoundCloud music with a trackable link applies here.
- Set a matched baseline. Pull the same measures for listeners who didn't attend, over the same weeks. The slip is comparing attendees to your entire fan base, which flatters every event.
- Measure 7-day repeat plays. This is the first honest signal that the event stuck. The slip is checking at day 30 only, by which time you can't tell what caused the return.
- Measure 30-day returns, comments and profile visits, plus next-event attendance. That last figure is the conversion the whole event exists to produce, so count it next to the 30-day returns rather than in a separate spreadsheet. The slip is tracking attendance at one event and never at the next.
- Compare the cohort against the baseline. Same window, same measures, two groups. The slip is comparing this event's numbers with the last event's numbers, which had a different crowd and a different month.
- Decide. If the cohort beats the baseline, run the format again. If it doesn't, change the format rather than the promotion.
Attribution is the part people skip, and it's the part that makes the rest work. If you've ever tagged a sign-up form to see which channel produced a contact, you already know the method; SourceLoop's guide to tracking lead sources walks through assigning a new contact to the channel that created them, which is precisely what an event code does for a listener.
Avoiding Misleading Metrics Before Your Next Event
Five reading errors show up again and again, and each has a fix you can apply this week.
- Counting turnout or ticket revenue as success. Judge the event by the cohort it leaves behind, not the door count.
- Treating every play as equal. Weight a four-second play below a full listen that ends in a comment.
- Judging a release by its day-one spike. Review at release day, at two weeks and at month two, because the third reading tells a different story.
- Centring every event on one genre, one single or one headline track. Use the entry points so eclectic listeners have a door to walk through.
- Counting identical comments or reposts posted in volume as engagement. They carry almost no signal, and SoundCloud's current Community Guidelines treat posting identical or nearly identical comments in large volumes, and repeatedly reposting or liking tracks already reposted or liked, as prohibited spammy behaviour. Replace volume with varied, relevant interaction.
The pre-event checklist
Five items, written down before the date goes public.
- Choose three metrics from the reference table, such as returning listeners, comments per 1,000 plays and repeat plays at 30 days. Three is enough to make a decision and few enough to collect.
- Set event tagging so the cohort is identifiable without guesswork.
- Record a baseline from the same period, before the event shifts anything.
- Set review dates at 7 days and 30 days in your calendar, with the metrics written next to them.
When you're choosing which three to carry into an event, it helps to see how other creators structure measurement; Social Cloud's guide to influencer marketing KPIs lays out the difference between vanity figures and the numbers that predict repeat behaviour.
Decision rule: run the same event again only if the cohort beats the baseline on at least two of your three metrics.
That rule protects you from your own enthusiasm. A packed room feels like proof, and the cohort data is the only thing that disagrees with you.
Pick your next event date now. Write the three metrics on a sheet of paper, note the 7-day and 30-day review dates beside them, and let the cohort, not the door, tell you whether it worked.
Your next release deserves an audience that comes back, and SCHelper is built for the stretch between events when that audience gets built. It puts a short, curated list of real listeners in front of you each day, matched to the artists and scenes you already sit near, and asks you to review it and start the conversation yourself. Visit SCHelper when you're ready to turn one good night into a listener base you can measure at day 30.